Engineering
Turning On Slow Query Logging Without Filling the Disk
MySQL 8.4 allows database administrators to enable, disable, and retarget the slow query log entirely at runtime.
Last reviewed
There is no need to restart the database daemon or interrupt incoming web traffic to find out why a database-backed application is stalling.

By adjusting two global system variables—slow_query_log and slow_query_log_file—an engineer can capture sluggish statements on a live server, gather the necessary evidence, and shut the logging off before the written output consumes available storage.
Runtime Configuration with Global Variables
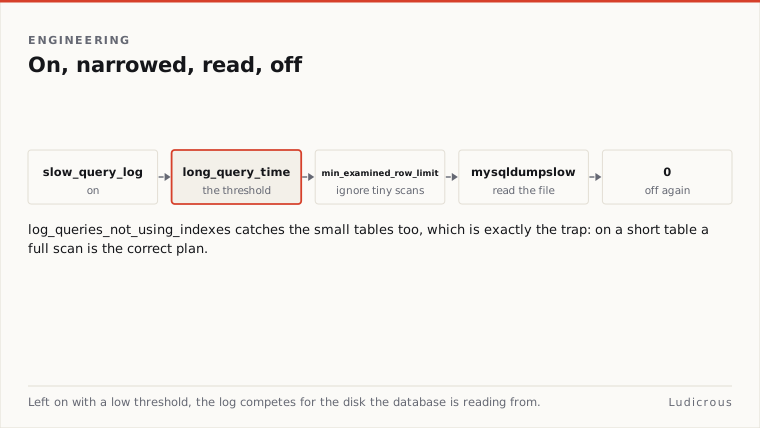
Diagnosing intermittent latency begins with setting MySQL's dynamic parameters directly through an administrative session. Setting the global variable slow_query_log to 1 turns the logging mechanism on, while setting it to 0 stops it immediately.
SET GLOBAL slow_query_log = 1;
SET GLOBAL slow_query_log_file = '/var/log/mysql/slow-queries.log';
According to documentation covering MySQL logging destinations, slow_query_log_file designates the path and name of the active log file. If a path is omitted or if legacy configurations rely on the default behavior described in Stack Overflow quoting MySQL behavior, MySQL automatically generates a file named host_name-slow.log inside the data directory.
Writing directly to the data directory can create maintenance headaches during an active incident. Specifying an explicit, absolute file path using slow_query_log_file ensures that logs land on a partition designated for diagnostic text files. Because both parameters update at runtime, switching the log target or stopping collection requires no downtime.
Calibrating the Execution Threshold
Once enabled, the engine evaluates every executed statement against specific criteria before appending it to the file. The slow query log records SQL statements that take more than long_query_time seconds to execute and require at least min_examined_row_limit rows to be examined.
SET GLOBAL long_query_time = 1.5;
SET GLOBAL min_examined_row_limit = 100;
The MySQL 9.1 Reference Manual lists the default value of long_query_time as 0 seconds and min_examined_row_limit as 10. A practical guide published by Bytebase states that the default long_query_time is 10 seconds.
Leaving a threshold at zero on a busy site forces the engine to log every completed statement, which will rapidly exhaust disk space. For focused troubleshooting, Bytebase recommends setting long_query_time to 1 or 2 seconds during production investigations.
The threshold supports microsecond resolution, allowing administrators to filter for sub-second delays if application requirements demand tighter latencies. Setting long_query_time to 0.200000, for instance, will catch any query taking longer than 200 milliseconds, provided it also meets the examined row threshold.
Index Traps and Small Tables
Slow execution time is not the only indicator of a poorly structured query. MySQL provides the log_queries_not_using_indexes system variable to record statements that execute full table scans or fail to utilize indexes for row lookups.
SET GLOBAL log_queries_not_using_indexes = 1;Bytebase points out that log_queries_not_using_indexes catches queries that bypass indexes even when they complete quickly because the underlying table remains small. In an early-stage deployment or a table with only a few dozen rows, a full table scan can return in under a millisecond. That same query pattern, however, will degrade as the table expands into hundreds of thousands of rows.
Enabling this variable expands the scope of the slow log. On a system with frequent table scans across small configuration tables, the log will expand rapidly. While the official MySQL reference manual describes the variable's technical function, it does not detail specific disk exhaustion warnings, making deliberate manual oversight mandatory when this toggle is active.
Parsing Output with mysqldumpslow
A raw slow query log records execution time, lock wait duration, rows sent, rows examined, timestamp data, and the literal SQL string for each captured query. Reading through raw text files line by line under production load is inefficient. The MySQL manual in Chinese warns that inspecting long slow query log files manually can be time-consuming, recommending the bundled mysqldumpslow utility to summarize and process the contents.
The mysqldumpslow tool parses the raw file and groups queries by stripping out specific numeric and string literals, converting distinct user queries into abstract query templates:
Mysqldumpslow -s t /var/log/mysql/slow-queries.logThe tool sorts these normalized query patterns by total execution time, count, or average duration. Instead of confronting thousands of individual entries, the administrator receives a ranked list showing which query structures cause the highest cumulative delay.
Disabling the Log After Investigation
Diagnostic logging should remain a temporary administrative intervention rather than a permanent background task. Once an active capture session produces a representative sample of offending queries, running an explicit disable command preserves remaining disk capacity:
SET GLOBAL slow_query_log = 0;
SET GLOBAL log_queries_not_using_indexes = 0;
Because MySQL retains the designated log file until it is archived or deleted externally, setting slow_query_log to 0 halts file writes without removing existing data. The administrator can analyze the captured file using mysqldumpslow, formulate structural fixes, and re-enable logging at a later point using the exact same runtime parameters.