WordPress
Debugging a White Screen Without Taking the Site Down Again
A production WordPress site serving an entirely blank page cannot be diagnosed by flipping basic error switches in the open.
Last reviewed
Turning on raw debugging without suppression prints stack traces, database credentials, and file paths directly to public browser sessions. According to WordPress Developer Resources, default system settings leave WP_DEBUG set to false, WP_DEBUG_LOG set to false, and WP_DEBUG_DISPLAY set to true. This default configuration means that simply setting WP_DEBUG to true causes WordPress to set the PHP display_errors runtime directive to 1, throwing uncaught fatal exceptions onto the screens of active site visitors.
Executing an effective wordpress white screen debug workflow requires routing failure notices away from the interface and into a private record. Managing the fault as an isolated logging sequence prevents live visitors from seeing raw code dumps while providing the exact line numbers needed to address the breakdown.
Define( 'WP_DEBUG', true );
Define( 'WP_DEBUG_DISPLAY', false );
Define( 'WP_DEBUG_LOG', true );
Directing PHP Output to Private Log Files
WordPress ties its internal debugging parameters directly to PHP engine settings. Documentation published on Learn WordPress explains that WP_DEBUG_DISPLAY maps to PHP's display_errors setting, while WP_DEBUG_LOG maps directly to PHP's error_log directive. If a developer sets WP_DEBUG_DISPLAY to true, WordPress actively forces PHP display_errors to 1. Conversely, setting WP_DEBUG_DISPLAY to false instructs the runtime to suppress all visual error output across the entire public theme and administrative backend.
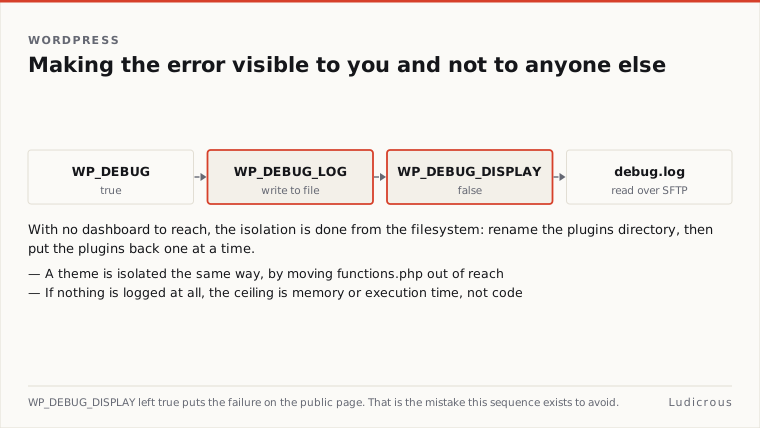
Neither WP_DEBUG_DISPLAY nor WP_DEBUG_LOG will execute any task if WP_DEBUG remains disabled. As recorded in WordPress Developer Resources documentation dating from March 2016, both secondary constants depend strictly on WP_DEBUG being defined as true. If WP_DEBUG is absent or set to false, the secondary directives do not fire, leaving the site silent.
+-------------------+--------------------+------------------------+
| WordPress Constant| Value Assigned | Resulting PHP Engine |
| | | Directive |
+-------------------+--------------------+------------------------+
| WP_DEBUG | true | Enables core debugging |
| WP_DEBUG_DISPLAY | false | display_errors = 0 |
| WP_DEBUG_LOG | true | error_log set to file |
+-------------------+--------------------+------------------------+
When WP_DEBUG_LOG receives a value of true, WordPress configures PHP error_log to write to wp-content/debug.log. WordPress Developer Resources also confirms that WP_DEBUG_LOG accepts an absolute, valid directory path string instead of a boolean value. Supplying a specific file path redirects error writes away from the standard location into any chosen destination accessible by the web server process.
Troubleshooting documentation published by WordPress.com in November 2025 specifies this exact three-line structure in wp-config.php. The developer edits the file, replaces define( 'WP_DEBUG', false ); with define( 'WP_DEBUG', true );, and appends the lines defining WP_DEBUG_DISPLAY as false and WP_DEBUG_LOG as true. All notices, warnings, and fatal errors redirect instantly into storage without printing a single character of output to the browser window.
Inspecting debug.log via SFTP for Non-Visual Failures
Once the logging parameters are active, the developer accesses the server over SFTP to retrieve the output. WordPress.com support documentation instructs engineers to connect over SFTP, navigate to the wp-content directory, and download or inspect debug.log.
This file-based capture method solves an operational blind spot that visual error messages cannot reach. A tutorial published by Learn WordPress in July 2023 points out that debug.log captures events that trigger entirely outside standard page generation. This includes background processes, AJAX requests, and wp-cron scheduled executions. When an automated task or background script runs out of memory or hits an uncaught exception, no user is loading a browser window to view an on-screen warning. The record inside wp-content/debug.log holds the only existing trace of the failure.
Inspecting the file directly provides the offending file path and line number. A fatal error caused by a missing method, a namespace mismatch, or an unhandled return value will appear chronologically at the bottom of the document:
PHP Fatal error: Uncaught Error: Call to undefined function custom_tax_handler in /var/www/html/wp-content/plugins/sample-addon/sample-addon.php:84Reading this line immediately points the developer to the origin of the crash. Isolating the issue through the recorded stack trace avoids changing production files or disabling systems blindly.
Isolating Plugin and Theme Conflicts Without Admin Access
When a fatal script error breaks the WordPress administrative dashboard, accessing /wp-admin/plugins.php to deactivate software through the graphical interface becomes impossible. WordPress.org support documentation outlines the isolation procedure for sites caught in this state.
The first procedural step requires disabling active plugins at the directory level. The engineer navigates to the wp-content directory over SFTP and renames the plugins folder to a temporary alternative, such as plugins-disabled. WordPress checks the file system for active plugin paths; upon failing to find them, it automatically deactivates all active extensions across the installation. If access returns immediately, the root failure exists inside one of the deactivated extensions. The developer can restore the original folder name and isolate the specific item by renaming individual subfolders one by one.
If the site continues to return a blank page after all plugins have been deactivated, WordPress.org troubleshooting documentation directs the administrator to switch the installation to a default theme. A syntax error inside a parent template or an active child theme's functions.php file will generate a persistent blank page regardless of plugin status. Renaming the active theme's folder forces WordPress to fall back to an installed core default theme, separating custom presentation code from core system operations.
Adjusting Memory Limits and PHP Execution Ceilings
If disabling both extensions and custom themes fails to clear the fault, the next item specified in WordPress.org documentation is the PHP memory allocation. A site that terminates execution without writing a syntax error to the screen often hits the ceiling allocated to the PHP worker process.
A memory exhaustion fault happens when an operation requires more memory than the server allows. The process halts mid-execution, terminating output before headers or HTML tags reach the browser. WordPress support documentation identifies increasing the PHP memory limit as a standard recovery step during a white-screen event. Raising the runtime ceiling in server configuration files gives memory-intensive processes the room required to complete execution cycles, preventing script starvation across database-heavy operations.
Checking the resulting log file after each systematic change confirms whether the failure was caused by a code-level crash or a hard resource exhaustion boundary.