 Engineering
Engineering
Measuring Core Web Vitals on a Real Site, Not in a Lab
A clean Lighthouse run can mislead an engineering team for months. Synthetic audits run in a controlled environment with predefined device and network settings, generating a single score under static conditions.
Last reviewed
Field data tells a different story because it records what happens when actual people load a URL across unmanaged conditions.

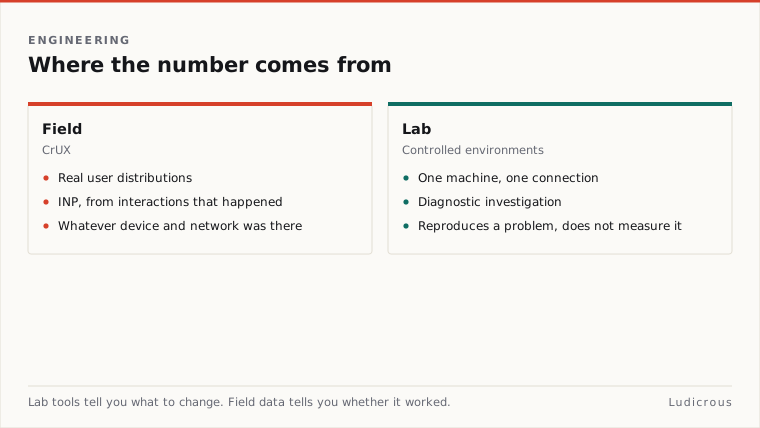
When engineers compare field data vs lab data core web vitals results, the disagreement stems from how those measurements are produced. Lab data freezes variables to produce reproducible tests. Field data captures real visitors navigating on whatever hardware, connection speed, and physical location they happen to use.
Understanding why these datasets diverge is the prerequisite for repairing poor field performance.
Why Controlled Environments Split from Real User Distributions
Lab tools execute tests against fixed constraints. A synthetic test sets a specific processor speed, enforces a predetermined network profile, and executes a clean page load from a single location. That design helps developers identify regressions during local builds, but it cannot represent the reality of live traffic.
Field data, commonly known as Real User Monitoring (RUM) data, collects metrics directly from visitors as they interact with pages. Because visitors arrive under wildly different circumstances, field data is not just one number. It is a distribution of numbers.
A single synthetic run might report a fast Largest Contentful Paint because the local machine has ample processing power and an unconstrained connection. On the live site, visitors using older mobile chipsets over congested cellular networks experience longer rendering delays. That range of outcomes forms a broad distribution curve.
When a team relies only on lab audits, they see a single point on that curve. That point frequently represents ideal hardware rather than the experience of visitors at the slower end of the spectrum.
How Google Evaluates Real User Monitoring and CrUX
Google determines whether a site meets the recommended Core Web Vitals thresholds by evaluating Real User Monitoring data, not synthetic lab scores.
That assessment relies on the Chrome User Experience Report (CrUX). CrUX collects anonymized, real user measurement data for each Core Web Vital across participating Chrome visitors. PageSpeed Insights surfaces this CrUX field data directly for sites that have accumulated enough traffic to be included in the dataset.
Because Google measures compliance through this field dataset, a green score in a synthetic audit carries no weight if the underlying CrUX distribution fails the target thresholds.
The evaluation criteria also depend on volume. Core Web Vitals assessments can be aggregated at either the page level or the origin level. When an individual URL lacks sufficient visits to generate a standalone field assessment, reporting tools fall back to the origin-level aggregation. For any aggregation that contains sufficient traffic across all three metrics, the assessment passes only if the 75th percentiles meet the required thresholds.
Passing requires 75 percent of recorded user visits to sit within the good range. If the slowest 25 percent of user sessions push past the target boundary, the entire assessment fails.
Isolating User Interaction Context with INP
Interactivity metrics expose the widest divide between local testing and live traffic. Interaction to Next Paint (INP) is the Core Web Vital that measures page interactivity across an entire session.
A lab runner loads a page, reaches an idle state, and stops. It does not type into search boxes, scroll through lengthy articles, open accordion menus, or trigger complex event listeners after the page has finished loading. As a result, synthetic audits offer little visibility into how a page responds to ongoing user input.
INP field data fills that blind spot. Real user records can provide contextual data that pinpoints the root causes of responsiveness problems:
- The specific interaction responsible for the delay, such as a search input or a navigation drawer.
- The interaction type, identifying whether the delay occurred on a click, a keypress, or a tap.
- The timing context, distinguishing between interactions that took place during initial page load and those that occurred after the page was fully rendered.
This contextual breakdown allows developers to trace input latency to specific page states. A tap that occurs while background scripts are parsing during initial boot will yield a very different latency profile than a click on a menu five minutes later. PageSpeed Insights surfaces this INP field data directly from CrUX for qualifying sites, giving engineering teams visibility into actual interaction bottlenecks.
Applying Lab Tools for Diagnostic Investigation
While field data defines whether a site passes or fails, it cannot replace lab tools during local debugging. Field metrics indicate that a problem exists at the 75th percentile, but they do not provide a sandbox to step through execution traces.
Lab tools provide the controlled environment needed to isolate underlying issues. Developers use Lighthouse, WebPageTest, and the Chrome DevTools performance panel to capture Web Vitals measurements under observable conditions.
The performance panel records full timeline traces, visualising script evaluation, long tasks, style recalculations, and layout shifts. That deep trace data lets engineers verify whether an optimization reduces script execution time before deploying changes to live traffic.
Lab tools serve as diagnostic instruments; field data serves as the measurement of record.
Targeting Largest Contentful Paint for Immediate Recovery
When teams work to pull their 75th percentile distributions into the passing tier, Largest Contentful Paint is often the most direct metric to address.
Largest Contentful Paint measures the render time of the largest image or text block visible within the viewport, recorded from the moment the page first begins to load. Unlike interaction metrics, which depend entirely on user actions after the initial view, LCP starts tracking from navigation start and completes during the initial load cycle.
Monitoring the field distribution after deploying those changes confirms whether real visitors experience the improvement. If the 75th percentile of the real user distribution moves below the target boundary across qualifying traffic, the page-level and origin-level assessments reflect the fix.
The central task in Core Web Vitals optimization is reconciling synthetic tests with live user conditions. Tracking CrUX distributions, debugging with DevTools and WebPageTest, and addressing LCP render timing gives developers the framework needed to close the gap between clean lab scores and verified field performance.