 Security & Ops
Security & Ops
Reading Your Access Log After Something Went Wrong
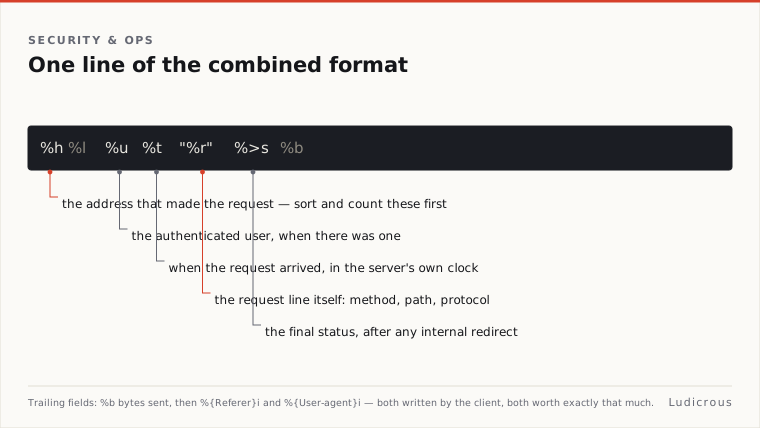
The Apache HTTP Server documentation defines its default Combined Log Format as %h %l %u %t "%r" %>s %b "%{Referer}i" "%{User-agent}i".
Last reviewed
When a web application begins returning unusual responses or unexpected files appear on disk, this single logging string provides the primary record administrators use to isolate unauthorized activity. Controlled by the server configuration's CustomLog directive, the file registers every incoming request processed by the daemon. Reconstructing an incident requires dissecting these exact parameters, separating normal read traffic from suspicious write submissions, and identifying where server-level logging stops and operating system inspection must begin.
Deconstructing the Combined Log Format
Apache documentation notes that the Combined Log Format is identical to the Common Log Format, but appends two specific HTTP request headers: the Referer (%{Referer}i) and the User-agent (%{User-agent}i). Each entry in the file represents a single HTTP transaction recorded across seven distinct fields.
The Apache HTTP Server documentation identifies %h as the client hostname or IP address, while %t records the exact timestamp when the request was received by the server. Between those two values sit %l, representing the remote logname if identd is present, and %u, which captures the authenticated HTTP username if the requested resource required basic authentication.
The core payload information sits in the remainder of the line. The %r directive stores the full request line as transmitted by the client. Following the request line, %>s records the final status code returned to the client, such as 200 for a successful transfer or 404 for a missing file. The %b field indicates the total size of the response sent to the client, measured in bytes.
192.0.2.45 - - "POST /wp-login.php HTTP/1.1" 200 4502 "-" "Mozilla/5.0"In certain production environments, standard byte logging is modified. NXLog’s platform documentation points out that some predefined formats use %O instead of %b. The %O modifier measures actual bytes transferred over the network, which allows administrators to detect partial requests where a connection dropped or terminated before the full body could travel across the wire.
Taken together, these fields allow an investigator to reconstruct request-level activity directly from the raw log stream.
Isolating POST Traffic and High-Volume Origin Addresses
Investigating a compromised server requires narrowing down hundreds of thousands of routine GET requests to find state-changing operations. Filtering POST requests is a standard starting step. Because the HTTP method is recorded inside the quoted request line (%r), standard text processing tools must isolate text within those quotation marks.
One documented approach uses awk to split the line on double quotes first. This separates the request line from the IP address and status codes. A secondary split on spaces extracts the HTTP method and the targeted resource path.
When an automated script attempts an exploit, POST request frequency from a single remote client increases sharply. A documented awk command sequence designed to count POST requests by source IP:
awk '$6 == "\"POST" {print $1}' access.log | sort | uniq -c | sort -rn | head -10
This filter checks the sixth whitespace-delimited field where the quoted request method begins. It pulls the client IP address from field one, groups duplicate entries together, totals them with uniq -c, sorts them in descending order, and displays the top ten source addresses.
Separating POST requests from background read requests is particularly effective during triage. Filtering POST submissions independently, filtering POST submissions independently surfaces automated bots, scrapers, and scripted submission tools that would otherwise stay hidden inside the larger volume of normal traffic.
Identifying Irregular Request Paths and Status Codes
Once suspicious IP addresses are identified, the next step involves inspecting the URI string within %r alongside the status code in %>s. Automated intrusion tools generate distinctive request patterns by scanning for configuration files, exposed administration panels, or unpatched auxiliary scripts.
The %r field preserves the exact string sent by the remote client. Malformed URI parameters, directory traversal strings, and unexpected file extensions remain visible in the record. A sequence of 404 status codes from a single IP address captured by %h indicates systematic file discovery. If that same address subsequently generates a 200 status code on an obscure path, the web server found and executed a script at that location.
The trailing header fields provide additional context for these requests. The %{Referer}i field indicates the referring webpage that linked the client to the URI, while %{User-agent}i logs the client software identifier. Custom attack scripts frequently transmit empty Referer headers or default script User-agents, differentiating automated requests from legitimate human navigation.
Evidentiary Limits and Host Integrity
Access logs provide request-level evidence, but they cannot show how the application executed internally. Apache documentation states that the access log records all requests processed by the server. It does not record what an application script did after it received the incoming data.
A 200 status code confirms only that the web server returned a standard success response. It does not prove that an application script performed safely or that a database query executed properly. The access log serves as a ledger of HTTP transactions at the web server boundary, not an internal trace of application execution.
Local log files also present an integrity risk during incident response. The server's CustomLog directive places log files on the local filesystem by default. If an attacker gains privileged access to the underlying host, local log files can be modified, truncated, or removed to hide activity. Local records on a compromised machine cannot be considered immutable.
Corroborating an incident requires comparing %t timestamps against filesystem modification times on disk. Matching the exact second an unusual POST request reached the server with the creation time of a newly modified file in the web root helps determine whether a specific HTTP request wrote unauthorized code to the host. Whether the local log file matches an untampered external copy remains the deciding factor when validating the server timeline.